The genome is more than a sequence of base pairs — it is a dynamically organised, functionally regulated system in which gene activity is controlled by epigenetic marks, chromatin architecture, transcription factor binding, and three-dimensional nuclear organisation. Structural and functional genomics bridges the gap between DNA sequence and biological function, revealing how the genome is packaged, regulated, and read in different cell types, developmental stages, and disease states. At BioinformaticsNext, we provide expert bioinformatics support for structural and functional genomics research — helping scientists decode the regulatory genome with precision and depth.
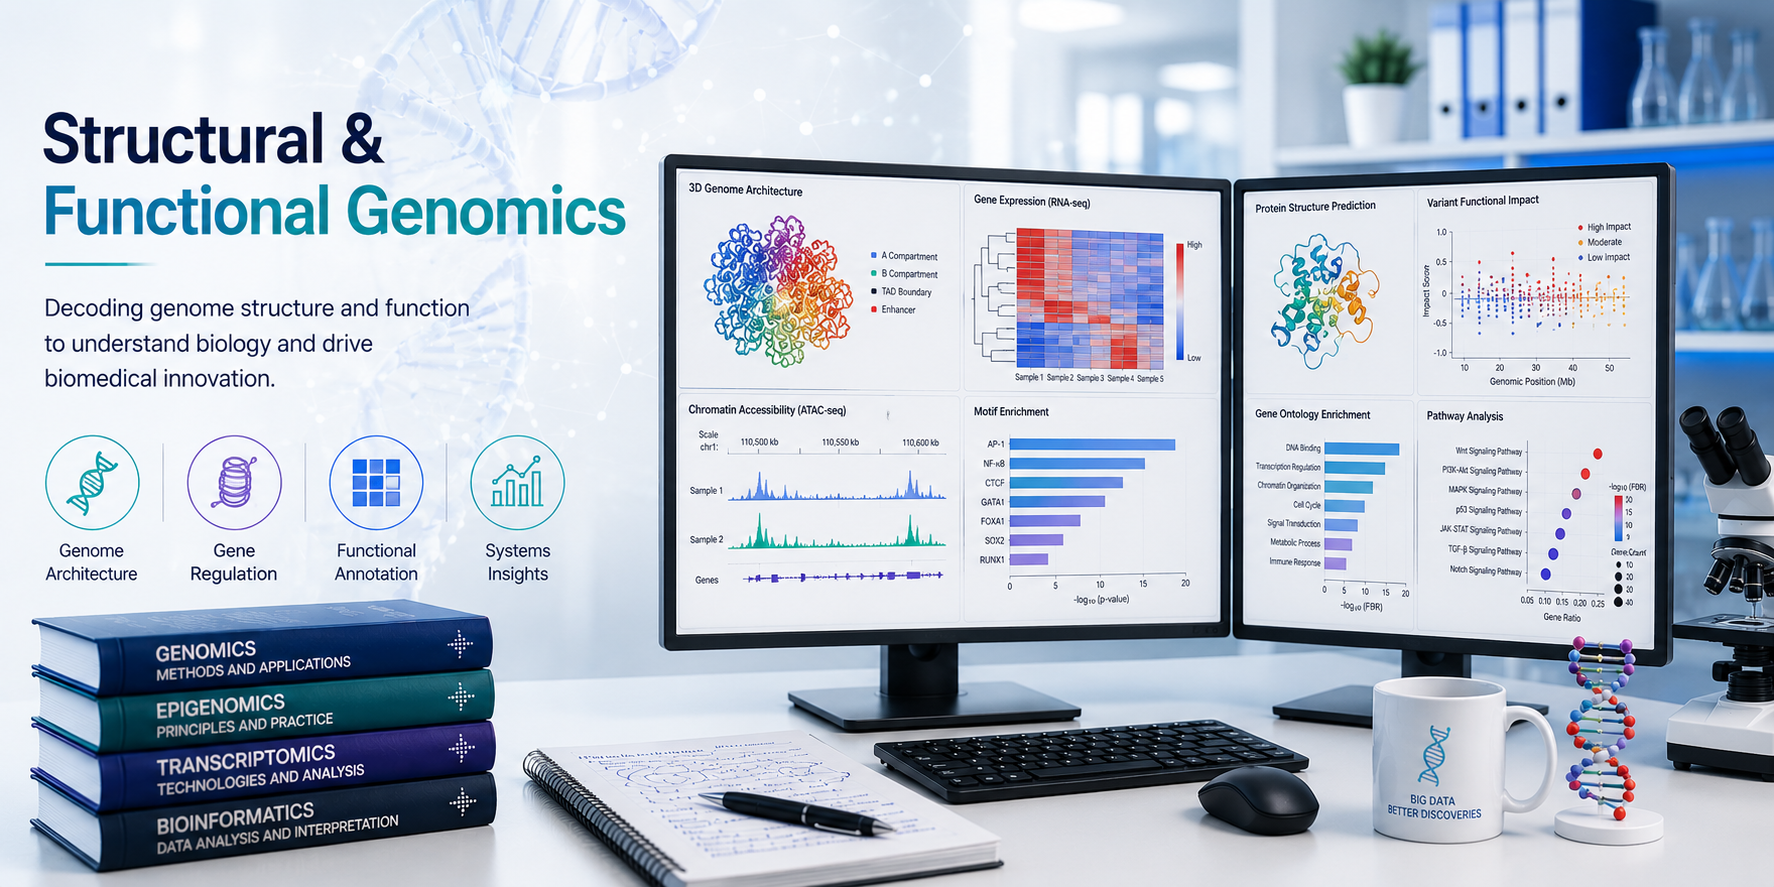
Bioinformatics for Structural & Functional Genomics
Decoding the regulatory genome — from chromatin accessibility to 3D nuclear organisation.
Understanding gene regulation requires going beyond the DNA sequence itself. Chromatin accessibility, histone modifications, transcription factor occupancy, DNA methylation, and three-dimensional genome organisation collectively determine which genes are expressed, when, and in which cell types. These regulatory layers are disrupted in cancer, developmental disorders, autoimmune disease, and metabolic conditions — making their characterisation essential for both basic biology and translational research.
At BioinformaticsNext, we provide validated, publication-grade bioinformatics pipelines for the full range of structural and functional genomics assays — from ChIP-seq and ATAC-seq to Hi-C and single-cell multiome analysis.
What We Analyse
Comprehensive regulatory genomics profiling across chromatin, methylation, TF binding, and 3D genome organisation.
- Chromatin accessibility and open chromatin regions across cell types and conditions
- Histone modification landscapes and their role in gene activation and silencing
- Transcription factor binding sites, motif enrichment, and regulon mapping
- DNA methylation patterns and differentially methylated regions in disease
- Three-dimensional genome organisation — topologically associating domains (TADs), compartments, and enhancer-promoter loops
- Non-coding regulatory element activity — enhancers, silencers, insulators, and promoters
- Epigenome-wide association studies (EWAS) linking methylation to traits and disease
- Single-cell epigenomics and multiome integration linking chromatin state to gene expression
Our Structural & Functional Genomics Services
Comprehensive bioinformatics support across the full range of structural and functional genomics assays and study designs.
All pipelines follow ENCODE and published best-practice guidelines and are version-controlled for full reproducibility.
1. ChIP-seq Analysis MACS3 · DiffBind · HOMER · Super-Enhancers
Chromatin immunoprecipitation followed by sequencing (ChIP-seq) is the gold-standard method for mapping histone modifications and transcription factor binding genome-wide. Our ChIP-seq analysis service delivers a complete workflow from raw reads to biologically interpreted regulatory maps.
- Raw read QC & preprocessing — FastQC, Trim Galore, and fastp for quality assessment and adapter trimming; spike-in normalisation for quantitative ChIP-seq (ChIP-Rx)
- Alignment — Bowtie2 alignment to reference genome; duplicate removal with Picard; blacklist region filtering using ENCODE blacklists
- Peak calling — Narrow peak calling for TF ChIP-seq and H3K4me3 with MACS3; broad peak calling for H3K27me3, H3K9me3, and H3K36me3 with MACS3 and SICER2
- Differential binding analysis — DiffBind and DESeq2 for identification of differentially enriched peaks between conditions, cell types, or treatments
- Motif enrichment analysis — De novo and known motif discovery at TF binding sites with HOMER, MEME-ChIP, and JASPAR database matching
- Peak annotation — Genomic feature annotation (promoter, enhancer, intron, intergenic) with ChIPseeker and annotatePeak; nearest gene assignment and regulatory context
- Signal visualisation — BigWig track generation for genome browser visualisation; heatmaps and average profile plots with deepTools computeMatrix and plotHeatmap
- Super-enhancer identification — ROSE algorithm-based super-enhancer calling from H3K27ac ChIP-seq data; SE-associated gene identification and pathway enrichment
2. ATAC-seq Analysis MACS3 · TOBIAS · chromVAR · NucleoATAC
Assay for Transposase-Accessible Chromatin using sequencing (ATAC-seq) maps open chromatin regions genome-wide with high sensitivity and low input requirements. It is widely used to identify active regulatory elements, nucleosome positioning, and transcription factor binding footprints.
- Raw read QC & preprocessing — FastQC, Trim Galore; adapter trimming with Trimmomatic; mitochondrial read removal; nucleosome-free region (NFR) and nucleosomal fragment separation
- Alignment & post-processing — Bowtie2 alignment; Tn5 insertion site shift correction (+4 / -5 bp); PCR duplicate removal; blacklist filtering
- Peak calling — MACS3 narrow peak calling on NFR fragments; IDR-based reproducibility filtering across replicates
- Differential accessibility analysis — DESeq2 and edgeR on peak count matrices; identification of condition-specific open chromatin regions
- Transcription factor footprinting — TOBIAS and HINT-ATAC for TF footprint detection within ATAC-seq peaks; differential footprinting between conditions to infer TF activity changes
- TF activity inference — chromVAR for per-sample TF motif accessibility scoring; identification of TFs with differential chromatin activity across cell states or conditions
- Nucleosome positioning — NucleoATAC for genome-wide nucleosome occupancy and positioning inference from ATAC-seq signal
- Integration with RNA-seq — Linking open chromatin peaks to nearby gene expression changes; identification of accessibility-expression correlated regulatory elements
3. DNA Methylation Analysis EPIC Array · WGBS · RRBS · EWAS · Clocks
DNA methylation is a stable epigenetic mark that regulates gene expression, genomic imprinting, X-chromosome inactivation, and transposable element silencing. Its dysregulation is a hallmark of cancer, ageing, and developmental disorders. We support the full range of DNA methylation assay platforms.
- Illumina EPIC / 450K array analysis — minfi and ChAMP preprocessing; background correction, normalisation (BMIQ, Noob), and quality control; beta and M-value extraction
- Whole-genome bisulfite sequencing (WGBS) — Bismark alignment with bisulfite-aware mapping; cytosine methylation extraction; CpG, CHG, and CHH context methylation quantification
- Reduced representation bisulfite sequencing (RRBS) — TrimGalore-based adapter and quality trimming; Bismark alignment; CpG coverage and methylation extraction
- Differentially methylated region (DMR) calling — DSS, methylKit, and bumphunter for DMR identification between conditions; regional methylation smoothing and statistical testing
- Differentially methylated position (DMP) analysis — limma-based DMP analysis for array data; multiple testing correction and effect size estimation
- Epigenome-wide association studies (EWAS) — EWAS of disease traits and exposures with appropriate cell-type composition correction (CETYGO, EpiDISH, reference-based deconvolution)
- Epigenetic clock analysis — Biological age estimation with Horvath, Hannum, GrimAge, PhenoAge, and DunedinPACE clocks; epigenetic age acceleration analysis
- Methylation-expression integration — Correlation of DMR / DMP methylation with nearby gene expression changes; methylation QTL (meQTL) mapping
4. CUT&RUN and CUT&TAG Analysis SEACR · Low-Input · Single-Cell
CUT&RUN and CUT&TAG are next-generation alternatives to ChIP-seq that offer higher resolution, lower background, and reduced input requirements — making them increasingly preferred for histone modification and TF mapping, particularly in rare cell populations.
- CUT&RUN analysis — Bowtie2 alignment with CUT&RUN-specific parameters; SEACR and MACS3 peak calling; IgG spike-in normalisation; differential enrichment analysis
- CUT&TAG analysis — Short fragment-aware alignment; peak calling optimised for Tn5-tagmented data; comparative analysis with matched ChIP-seq or ATAC-seq datasets
- Low-input and single-cell CUT&TAG — scCUT&TAG data processing; cell-type-specific TF binding and histone modification profiling at single-cell resolution
5. Hi-C & 3D Genome Organisation Analysis TADs · Compartments · Loops · HiChIP
The three-dimensional organisation of the genome in the nucleus is not random — it is functionally structured into compartments, topologically associating domains (TADs), and specific enhancer-promoter loops that control gene expression. Hi-C and related techniques map these spatial relationships genome-wide.
- Hi-C data processing — HiC-Pro and Juicer pipeline processing; read mapping, ligation junction filtering, and contact matrix construction at multiple resolutions
- Compartment analysis — A/B compartment calling from Hi-C eigenvectors; compartment switching between conditions; correlation with gene expression and histone marks
- TAD identification — Topologically associating domain boundary calling with insulation score, arrowhead, and HiCDB; differential TAD analysis between conditions
- Loop calling — Chromatin loop and enhancer-promoter interaction identification with HICCUPS, FitHiC2, and Mustache; loop anchor annotation with ChIP-seq and ATAC-seq data
- Differential 3D genome analysis — Identification of structural changes in TADs, compartments, and loops between disease and control, or between treatment conditions
- Capture Hi-C & HiChIP — Targeted chromatin interaction analysis at specific genomic loci; H3K27ac HiChIP for active enhancer-promoter loop mapping
6. Single-Cell Epigenomics scATAC-seq · Multiome · ArchR · Signac
Single-cell epigenomics technologies — including scATAC-seq, single-cell CUT&TAG, and the 10x Genomics Multiome — enable the simultaneous profiling of chromatin accessibility and gene expression in individual cells, revealing the epigenetic diversity within complex tissues and tumours.
- scATAC-seq analysis — Cell Ranger ATAC processing; peak-by-cell matrix construction; SnapATAC2 and ArchR-based dimensionality reduction, clustering, and cell-type annotation
- Single-cell CUT&TAG — scCUT&TAG data processing; histone modification profiling at single-cell resolution; cell-type-specific regulatory state identification
- 10x Multiome (scRNA-seq + scATAC-seq) — Joint RNA and ATAC profiling; Seurat WNN integration; linking chromatin accessibility to gene expression in the same cells
- TF activity inference from scATAC-seq — chromVAR motif activity scoring per cell; cell-type-specific TF regulon identification; differential TF activity between cell states
- Cis-regulatory element to gene linkage — Peak-to-gene correlation analysis in single cells; identification of cell-type-specific enhancer-gene pairs with ArchR and Signac
- Pseudotime epigenomic analysis — Trajectory inference from scATAC-seq data; chromatin accessibility dynamics along differentiation or activation trajectories
7. Functional Annotation & Regulatory Element Analysis ChromHMM · SCENIC · GWAS Overlap · Conservation
Interpreting the functional significance of genomic variants and regulatory regions requires integration with reference epigenomic datasets, evolutionary conservation, and gene regulatory networks. We provide comprehensive functional annotation of regulatory elements and non-coding genomic regions.
- Enhancer identification and classification — Active enhancer (H3K27ac+, H3K4me1+), poised enhancer (H3K4me1+, H3K27ac-), and super-enhancer annotation from ChIP-seq data
- Promoter activity mapping — H3K4me3 and H3K27ac-based active promoter identification; bivalent promoter (H3K4me3+ / H3K27me3+) calling in stem cells and progenitors
- Non-coding variant annotation — Overlap of GWAS variants with regulatory elements; eQTL and chromatin accessibility QTL (caQTL) integration for functional variant prioritisation
- Transcription factor network reconstruction — TF-target gene network inference from ChIP-seq and ATAC-seq data; regulon construction with SCENIC and DoRothEA
- Chromatin state segmentation — Hidden Markov model-based genome segmentation with ChromHMM and Segway; multi-mark chromatin state annotation using reference ENCODE/Roadmap models
- Evolutionary conservation analysis — PhyloP and GERP++ constraint score integration; identification of ultra-conserved non-coding elements and their regulatory function
Key Applications
Research applications across basic biology, disease, and drug discovery.
- Cancer epigenome characterisation and enhancer hijacking analysis
- Developmental gene regulation and cell fate determination
- Epigenetic drug target identification and mechanism of action
- Non-coding variant functional interpretation in GWAS loci
- Stem cell epigenomic profiling and pluripotency regulation
- Immune cell chromatin remodelling and activation states
- 3D genome reorganisation in disease and development
- Transcription factor network rewiring in cancer
- Epigenetic ageing and biological clock analysis
- Environmental epigenomics and exposure-associated methylation
- Regulatory element discovery in non-model organisms
- Multi-omics epigenomic integration for biomarker discovery
Our Analytical Workflow
A structured, reproducible process from initial data assessment to final interpreted results and written report.
Step 1 — Project Scoping Free
We discuss your assay type, cell or tissue type, experimental design, and research questions to define the most appropriate analytical approach and deliverables.
Step 2 — Data Receipt & QC
Secure encrypted data transfer; comprehensive QC (FastQC, MultiQC, ATACseqQC, ChIPQC) before any analysis begins.
Step 3 — Pipeline Configuration
Version-controlled pipeline setup following ENCODE best-practice guidelines; tool selection matched to your assay type and study design.
Step 4 — Primary Analysis
Alignment, peak calling, methylation extraction, or contact matrix construction as appropriate; all intermediate files retained for auditability.
Step 5 — Differential Analysis
Differential binding, differential accessibility, or DMR calling between conditions; statistical testing with appropriate correction for multiple comparisons.
Step 6 — Functional Annotation
Peak and DMR annotation with regulatory element databases, gene regulatory networks, and reference epigenomic datasets.
Step 7 — Visualisation
Publication-ready figures — genome browser tracks, heatmaps, average profiles, volcano plots, TAD maps, and chromatin state diagrams.
Step 8 — Report & Manuscript Support Optional
Full written report with methods, results, and biological interpretation; optional manuscript methods section and figure legend preparation.
Tools & Technologies
Validated, ENCODE-endorsed, and actively maintained tools across all structural and functional genomics pipelines.
- Alignment: Bowtie2, BWA-MEM2, Bismark, HISAT2
- Peak Calling: MACS3, SICER2, SEACR, GoPeaks
- Differential Analysis: DiffBind, DESeq2, edgeR, methylKit, DSS
- TF Footprinting: TOBIAS, HINT-ATAC, JASPAR, MEME-ChIP
- TF Activity: chromVAR, SCENIC, DoRothEA, VIPER
- Methylation: bismark, minfi, ChAMP, DSS, bumphunter
- 3D Genome: HiC-Pro, Juicer, HICCUPS, FitHiC2, TADbit
- scATAC-seq: ArchR, SnapATAC2, Signac, Cell Ranger ATAC
- Multiome: Seurat WNN, ArchR, GLUE, MultiVI
- Chromatin States: ChromHMM, Segway, EpiCSeg
- Annotation: ChIPseeker, annotatePeak, GREAT, Homer
- Signal Processing: deepTools, bamCoverage, computeMatrix
- Visualisation: IGV, pyGenomeTracks, ggplot2, ComplexHeatmap
- Workflow: Snakemake, Nextflow, nf-core/chipseq, nf-core/atacseq
Reference Databases & Resources We Use
All major epigenomics and functional genomics reference resources for comprehensive annotation and biological interpretation.
- ENCODE — Reference ChIP-seq, ATAC-seq, and RNA-seq datasets across hundreds of cell types; ENCODE blacklists for peak filtering; functional annotation tracks
- Roadmap Epigenomics — Reference epigenomic maps across primary human tissues and cell types; chromatin state models for comparative analysis
- JASPAR 2024 — Curated transcription factor binding site motif database for motif enrichment and TF footprinting analysis
- GEO / ArrayExpress — Public ChIP-seq, ATAC-seq, and methylation datasets for comparative and meta-analysis
- GTEx v8 — Tissue-specific eQTL data for integration with chromatin accessibility and methylation QTL analyses
- UCSC Genome Browser / Ensembl — Reference genome annotation, regulatory build tracks, and conservation scores for peak annotation
- dbSNP / ClinVar — Variant databases for overlap analysis with regulatory elements and non-coding GWAS variants
- FANTOM5 — Enhancer and promoter activity maps across human tissues and cell types from CAGE sequencing data
- 4D Nucleome — Hi-C and 3D genome reference datasets across cell types for comparative 3D genome analysis
Project Deliverables
A complete, structured set of outputs ready for publication, grant submission, or downstream integration.
- Quality control report (MultiQC HTML + PDF, ChIPQC or ATACseqQC) for all samples
- Processed data files: aligned BAMs, BigWig tracks, peak BED files, methylation matrices
- Differential analysis results: annotated peak tables, DMR / DMP lists with statistics
- Publication-ready figures (PDF, SVG, PNG at 300 dpi)
- Full written report: methods, results, biological interpretation, and recommendations
- Pipeline scripts and configuration files for full reproducibility
- Post-delivery consultation call for results walkthrough and Q&A
- Genome browser session files (UCSC, IGV) with all tracks pre-loaded
- Chromatin state annotation tracks in BED and BigBed format
- Manuscript methods section and figure legends (journal-formatted)
- Supplementary data tables and extended figure sets
- Custom R Shiny epigenomics explorer for interactive data browsing
- Long-term retainer support for multi-timepoint or multi-condition epigenomics projects
Why Choose BioinformaticsNext?
Deep epigenomics expertise combined with ENCODE-compliant, validated pipelines — delivering results that are scientifically rigorous, reproducible, and publication-ready.
Epigenomics Expertise
Our analysts have hands-on experience with ChIP-seq, ATAC-seq, bisulfite sequencing, Hi-C, and single-cell epigenomics across a wide range of biological systems and disease contexts.
ENCODE-Compliant Pipelines
All ChIP-seq and ATAC-seq workflows follow ENCODE Consortium best-practice guidelines, ensuring your results meet the highest standards of reproducibility and quality.
End-to-End Service
From raw FASTQ files to annotated peaks, DMRs, and genome browser tracks — every step handled in-house with no need for your own bioinformatics infrastructure.
Fast Turnaround
Most projects are delivered within 2–4 weeks. Rush turnarounds are available for grant deadlines and conference submissions.
Multi-Assay Integration
We routinely integrate ChIP-seq, ATAC-seq, RNA-seq, Hi-C, and methylation data into unified regulatory maps — providing biological insight that no single assay can deliver alone.
Flexible Engagement
Project-based, hourly, or long-term retainer arrangements tailored to your timeline and budget with no minimum commitment.
Data Security
Encrypted data transfer and storage. NDAs and GDPR-compliant Data Processing Agreements available upon request.
Global Reach
UK-headquartered with clients across Europe, North America, the Middle East, and Asia-Pacific.
Frequently Asked Questions
Common questions from structural and functional genomics clients.
Requirements vary by assay. Standard ChIP-seq typically requires 1–10 million cells per immunoprecipitation. ATAC-seq can be performed on as few as 500–50,000 cells, and CUT&RUN / CUT&TAG require as few as 100–10,000 cells. For FFPE tissue or low-input samples, we advise on appropriate assay modifications and adjusted QC thresholds during the project scoping call.
ChIP-seq is the established standard with the largest body of reference data, but requires more input material and has higher background. CUT&RUN offers higher resolution and lower background with less input. CUT&TAG is the most scalable and compatible with single-cell approaches. We can help you select the most appropriate assay for your target, cell type, and research question during the free scoping consultation.
Yes. FFPE samples are compatible with Illumina EPIC methylation arrays, which are robust to the degraded DNA typical of FFPE material. For bisulfite sequencing of FFPE samples, we apply FFPE-specific quality filters and artefact correction. We advise on sample selection and quality thresholds during project scoping.
Absolutely. We regularly integrate newly generated datasets with public reference data from ENCODE, Roadmap Epigenomics, GEO, and ArrayExpress — enabling comparative analysis across cell types, tissues, and disease states. This is particularly valuable for contextualising your results within the broader epigenomic landscape.
Yes. Our epigenomics pipelines are reference-agnostic and support any organism with an available genome assembly. We have experience with mouse, rat, zebrafish, Drosophila, Arabidopsis, and other model organisms, as well as non-model species where reference genomes are available.
Absolutely. We assist with the epigenomics and functional genomics sections of grant applications — including experimental design justification, proposed analytical workflows, and preliminary data generation. Please get in touch as early as possible in the grant preparation process.
Related Research Areas & Services
Structural and functional genomics intersects with multiple other research domains we support.
- Cancer & Oncogenomics — Cancer epigenome characterisation, enhancer hijacking, and epigenetic driver identification in tumour genomes
- Genetics & Genomics — Non-coding variant functional annotation; chromatin QTL analysis; integration of GWAS signals with regulatory element maps
- Immunology & Immuno-Oncology — Immune cell epigenomics; T-cell exhaustion chromatin states; epigenetic regulation of immune activation and memory
- Drug Development & AI Discovery — Epigenetic drug target characterisation; chromatin accessibility-based MoA profiling; enhancer-driven target identification
- Custom Software & Pipeline Development — Bespoke epigenomics data portals, genome browser integration, and automated ChIP-seq / ATAC-seq pipeline deployment
Ready to Decode the Regulatory Genome?
Tell us about your assay, your cell or tissue type, and your research questions. Our structural and functional genomics team will design a tailored analytical plan — typically within 48 hours of your enquiry. Whether you are mapping enhancer landscapes, characterising methylation changes in a disease cohort, or integrating single-cell epigenomics with transcriptomics, we are here to support you from day one.